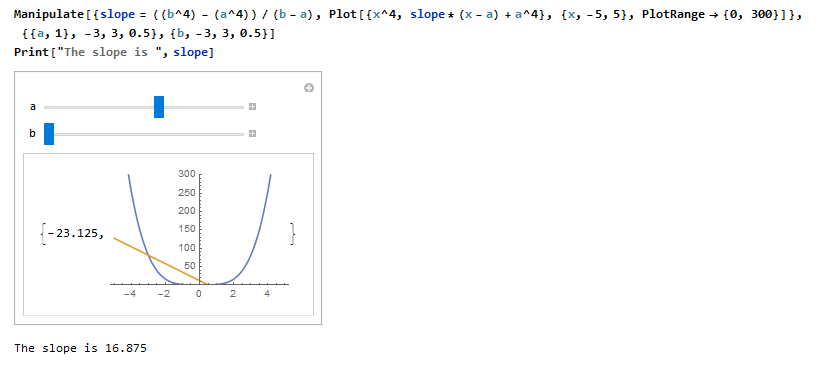
In mathematics, we use technology to illustrate and model specific concepts. For the Coordinating Seminar course at Mount Saint Mary College, I constructed a Mathematica file that contained different functions, and we compared different points on the graph to find the slope of the line. In addition to this, I also reminded students that the average rate of change has to do with the slope of the line at a given point(s). Additionally, students were taught and guided through using Mathematica to find derivatives, and find the equation of a line. This is a screenshot of one of the problems done, and the worksheet file is attached at the bottom.